Quick summary: Discover the hidden environmental cost of packaging waste from carbon emissions to ocean pollution. Learn how it impacts your business, ESG goals, and how to reduce it effectively.
Walk through any supermarket, open any e-commerce delivery, or clear out a kitchen cabinet and you are surrounded by packaging. Bottles, pouches, films, foam, cardboard, blister packs. Most of it designed to be used once and thrown away in seconds. The convenience is real. So is the cost and most of it never appears on any invoice. The environmental cost of packaging waste is staggering in scale, insidious in mechanism, and largely invisible to the people who generate it.
It shows up in poisoned fish. In microplastics found inside human hearts and lungs. In accelerating carbon emissions. In a growing global recycling crisis that isn’t solving the problem it’s hiding it.
This report cuts through the noise. It quantifies what packaging waste is actually costing the planet, maps the hidden pathways of harm, and critically identifies what businesses and policymakers can do right now to change the trajectory.
The world generates approximately 353 million metric tonnes of plastic waste per year nearly a million metric tonnes every single day. Of this, only around 9% is recycled OECD Global Plastics Outlook
The numbers surrounding packaging waste are so large they can lose meaning. Let’s make them tangible.
| Metric | Scale | Source |
|---|---|---|
| Global plastic waste generated per year | 353 million metric tonnes | OECD |
| Share that is packaging | 40% — approximately 141 million tonnes | Our World in Data |
| Plastic entering oceans annually | 11 million tonnes (2,000 garbage trucks/day) | UNEP 2025 |
| U.S. packaging waste generated (2018) | 82.2 million U.S. tons (28.1% of all trash) | U.S. EPA |
| Only recycled globally | ~9% of all plastic waste | OECD |
| Landfilled globally | ~50% of all plastic waste | OECD |
| Incinerated globally | ~19% of all plastic waste | OECD |
| Leaks into environment | ~22% — mismanaged or open-burned | OECD |
| Plastic in oceans currently | 75–199 million tonnes | Ocean Research, 2025 |
| Projected plastic waste by 2060 | ~1 billion metric tonnes under current trends | OECD |
The United States alone produces nearly 40 million tons of plastic waste annually much of it packaging with only around 5% being recycled. In 2022, the U.S. recycling rate for plastic packaging was just 13.6%. Despite decades of public recycling campaigns, the infrastructure has not kept pace with production volumes.
The environmental cost of packaging waste is not a single crisis it is five overlapping crises, each with its own mechanisms and timescales of harm.
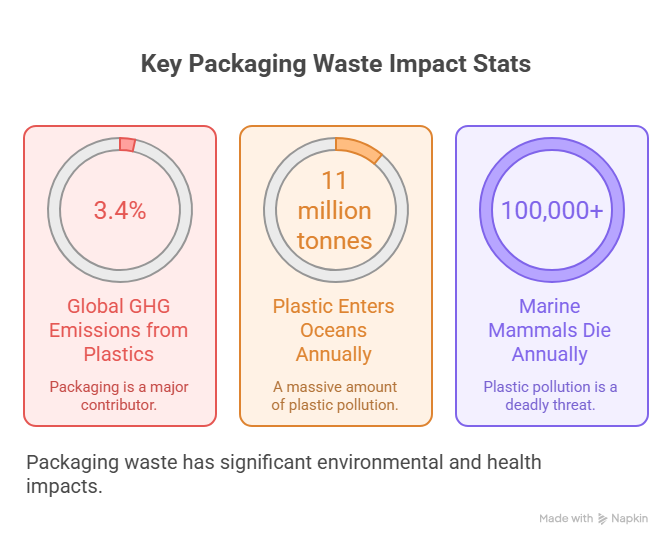
Plastic is made almost entirely from fossil fuels. 99% of plastic products require fossil fuel feedstocks. The production process extraction, refining, polymerization, manufacturing is energy-intensive at every stage. Plastic production accounts for 3.4% of global greenhouse gas emissions. Scientists project that if current trends continue, plastic production alone will account for 56 gigatons of CO2 emissions between now and 2050.
But the carbon story doesn’t end at production. Incinerating plastic waste the disposal method used for 19% of global plastic can release more CO2 per tonne than burning coal. And even landfilling, often perceived as the ‘safe’ option, generates methane over long timescales as organic packaging components decompose under anaerobic conditions.
| Packaging waste isn’t just a pollution problem it’s a climate problem. Every tonne of virgin plastic produced emits roughly 1.7–3.5 kg of CO2-equivalent per kg of material. Multiply that by hundreds of millions of tonnes annually, and the climate math becomes alarming. |
Approximately 11 million tonnes of plastic enter the ocean every year the equivalent of 2,000 garbage trucks being emptied into our seas, rivers, and lakes every single day. There are currently between 75 and 199 million tonnes of plastic already in the world’s oceans, with more arriving constantly.
The ecological damage is not abstract. More than 100,000 marine mammals and 1 million seabirds are killed by marine plastic pollution every year. Plastic debris increases coral disease likelihood by 89%, accelerating bleaching that has already affected 75% of the world’s reefs. The Great Pacific Garbage Patch an accumulation zone roughly twice the size of Texas contains 1.8 trillion pieces of plastic and continues to grow.
Under business-as-usual projections, pollution from plastic packaging will more than double between 2025 and 2040. By 2050, there could be more plastic in the sea by weight than fish.
Plastic doesn’t disappear. It breaks down. A plastic bottle may persist in the environment for 450 years; fishing line for 600. As these materials fragment, they become microplastics particles smaller than 5mm and eventually nanoplastics. These particles are now found everywhere: Arctic sea ice, mountain-top soils, deep ocean trenches, rainwater, and the human body.
Microplastics have been detected in human hearts, lungs, livers, spleens, kidneys, and brains. They have been found in the placentas of newborn babies. Microplastic pollution currently constitutes 13% of global plastic pollution and under business-as-usual, will grow from 17 million to 26 million tonnes annually by 2040.
| Health Risk | Mechanism | Status |
|---|---|---|
| Endocrine disruption | Chemicals in plastic disrupt hormone systems | Confirmed — found in food packaging widely |
| Oxidative stress | MP ingestion induces cellular inflammation | Peer-reviewed, confirmed in multiple studies |
| Cancer risk | MPs associated with carcinogenic compounds | Under active research growing evidence |
| Foetal development | MPs found in human placentas | Confirmed implications being studied |
| Ocean carbon sink damage | MPs disrupt plankton, reducing CO2 absorption | 2026 research emerging systemic risk |
More than a quarter of the 16,000+ chemicals used in plastic products have been identified as possible sources of harm to human health. At least 4,219 of these chemicals are associated with hazardous properties including persistence, bioaccumulation, and endocrine disruption.
Half of all plastic waste globally ends up in landfills. In the United States, over 85% of municipal plastic waste ends up in landfills. These sites leak leachate chemically complex liquid containing plastic additives, heavy metals, and persistent organic pollutants into surrounding soil and groundwater systems.
The volume of packaging waste entering landfills is accelerating. E-commerce growth is a major driver: in 2019, the e-commerce industry used approximately 1 million tonnes of plastic for packaging. That figure was projected to more than double to 2 million tonnes by 2025, driven by approximately 200 billion parcels shipped globally. Online retail also generates a 15.2% return rate nearly three times the 5% in-store return rate meaning much of that packaging is used twice (once out, once back) before being discarded.
The environmental costs of packaging waste are beginning to convert into hard financial liability. A report estimated that liabilities related to plastic pollution are projected to cost the industry $100 billion as litigation for damages scales up with around $20 billion forecast in the United States alone.
Simultaneously, Extended Producer Responsibility (EPR) regulations are making those costs explicit. The EU now requires all member states to have operational EPR programs for packaging. California’s SB54 mandates a 25% reduction in single-use plastic packaging by 2032. The UK, Spain, and Italy have implemented plastic taxes. India mandates 30% recycled content in beverage packaging. These are not distant threats they are current operating costs for packaging businesses that have not yet adapted.
| Packaging businesses that treat environmental cost as an externality are borrowing against a bill that regulators and litigators are now actively collecting. The era of cost-free plastic waste is ending. |
The explosive growth of e-commerce has created a packaging waste amplifier unlike anything the industry has previously managed. In 2024, e-commerce accounted for 20.1% of global retail sales totaling $6.334 trillion. Approximately 167 billion parcels were shipped worldwide in 2023, with that number expected to reach 200 billion by the end of 2025.
Each of those parcels typically involves multiple layers of packaging: an outer box or mailer, void fill, inner product packaging, and sometimes individual item wrapping. Much of this is plastic. Studies of e-commerce packaging show that protective plastic (35%) and pouches/bags (32%) are the two most prevalent packaging plastic types both highly problematic for recycling infrastructure.
| E-Commerce Packaging Metric | Scale |
|---|---|
| Global parcels shipped annually (2023) | 167 billion |
| Projected global parcels by 2025 | 200 billion |
| E-commerce plastic packaging (2019) | ~1 million tonnes |
| Projected e-commerce plastic waste by 2025 | >2 million tonnes (doubling) |
| Online return rate vs. in-store | 15.2% vs 5% — 3x higher |
| CO2 from e-commerce returns annually | 24 million tonnes |
| Products sent to landfill vs restocked | 9.5B lbs of returns in 2022 went directly to landfill |
One of the most persistent hidden costs of packaging waste is the infrastructure deficit that makes recycling targets largely theoretical. In the United States alone, the EPA estimates that up to $43 billion is needed to modernize recycling infrastructure to provide all citizens with access to services equivalent in quality to trash disposal. Currently, one-third of U.S. households lack access to equivalent-quality recycling services.
The result: even packaging marked as ‘recyclable’ frequently isn’t recycled. In Germany one of the world’s leaders in recycling up to 40% of waste in recycling bins is incorrectly sorted, reducing the effective recycling rate significantly. South Korea, which reports a 73% plastic recycling rate, has an estimated effective recycling rate of just 27%.
The gap between reported and actual recycling is one of the packaging industry’s most consequential hidden costs and it erodes the consumer trust that brands depend on.
The sustainable packaging market is projected to grow from $292.71 billion in 2024 to $423.56 billion by 2029 a CAGR of 7.67%. Reusable packaging systems can reduce solid waste by up to 96%. A 10% increase in reusable beverage packaging by 2030 could eliminate over 1 trillion single-use plastic bottles and cups. The business case is not just moral it is commercial.
56% of consumers believe it’s important for brands to offer reusable products and packaging. 78% of U.S. consumers actively look for recyclable options. 49% already avoid products with excessive packaging. These are not niche preferences — they are mainstream purchasing criteria that increasingly determine shelf and click-through performance.
Explore how sustainable packaging is reshaping compliance and circular economy goals.
Learn how businesses are improving recyclability, reducing packaging waste, and building future-ready packaging strategies aligned with evolving sustainability regulations.
Not all packaging interventions are equally effective. Here is the evidence-based hierarchy of impact, from highest to lowest:
| ✓ | REDUCE FIRST: Eliminate unnecessary packaging before optimizing remaining packaging the highest-impact intervention with no offsetting emissions. |
| ✓ | DESIGN FOR CIRCULARITY: Switch to mono-materials that can enter existing recycling streams multi-layer composites are the primary barrier to effective recycling. |
| ✓ | INVEST IN REUSE SYSTEMS: Build reverse logistics for refillable containers. Systems like RECUP (coffee cups) and RePack (shipping) are now operating across 20+ countries. |
| ✓ | INCREASE RECYCLED CONTENT: Use post-consumer recycled (PCR) materials in new packaging diverts waste AND reduces virgin material demand simultaneously. |
| ✓ | COMPOSTABLE AS A LAST RESORT: Industrial compostable packaging works only where collection infrastructure exists do not over-rely on compostability claims without verifying local processing. |
| ✓ | ELIMINATE PFAS AND HARMFUL ADDITIVES: Japan, Australia, and the EU are banning PFAS in food packaging proactive elimination avoids regulatory risk and reduces health liability. |
| ✓ | PARTICIPATE IN DEPOSIT RETURN SCHEMES: Ireland’s DRS returned 630 million containers in eight months deposit return systems are the single most proven recovery mechanism for beverage packaging. |
Explore how businesses are redesigning packaging systems for reuse, recyclability, waste reduction, and long-term sustainability compliance.
| Regulation | Region | Key Requirement | Timeline |
|---|---|---|---|
| EU Packaging & Packaging Waste Regulation | Europe | All packaging recyclable by 2030; reuse targets | 2024–2030 |
| California SB54 | USA | 25% reduction in single-use plastic packaging; 65% recycling rate | By 2032 |
| EU Single-Use Plastics Directive | Europe | Ban straws, cutlery, cotton bud sticks | Active |
| India Recycled Content Mandate | India | 30% recycled content in beverage packaging | Active 2025 |
| UK/Spain/Italy Plastic Tax | Europe | Levy per tonne of plastic packaging placed on market | Active |
| Vietnam EPR for Packaging | Southeast Asia | Producers pay into Environmental Protection Fund | Active 2024 |
| Japan PFAS Ban in Packaging | Japan | Eliminate PFAS from food packaging | 2025 |
| Australia Packaging Recyclability | Australia | All packaging recyclable or compostable | Target 2025 |
PPWR will define how businesses source, package, and sell products in Europe.
Read our complete guide to the Packaging and Packaging Waste Regulation (PPWR)
Understanding the problem is step one. Action is the only thing that changes outcomes. Here is a structured pathway for packaging businesses, brands, and policymakers:
Map every packaging SKU by material type, weight, recyclability status, and disposal pathway. This baseline is the prerequisite for every other action. Without knowing what you’re putting into the world, you cannot measure progress or set credible targets.
Vague goals like ‘more sustainable by 2030’ are now actively harmful they invite regulatory scrutiny and consumer skepticism. Set specific, measurable, time-bound targets: percentage recycled content by year, percentage mono-material by year, recycling rate by SKU. Align with frameworks like the Ellen MacArthur Foundation’s Global Commitment or the Science Based Targets initiative.
Bioplastics are projected to grow at 10.1% CAGR the fastest of any packaging material segment. Fiber-based packaging already has proven circular infrastructure and leads with 40% market share. Seaweed/algae-based packaging is emerging for food applications. The material landscape is changing faster than most procurement cycles build supplier relationships with circular material innovators now.
65% of beauty brands have reduced virgin plastic output since 2018 by working with suppliers on PCR materials. E.l.f. Cosmetics removed over 1 million pounds of packaging by eliminating secondary cartons. These gains come from supply chain conversations not just design room decisions. Require sustainability data from every packaging supplier and integrate it into procurement scorecards.
Greenwashing is now a legal and commercial liability. Two-thirds of UK plastic waste is branded pollution meaning your product may be identifiable in ocean debris. Consumers who feel misled by environmental claims reduce brand loyalty and actively share negative sentiment. Replace generic claims (‘eco-friendly’, ‘green’) with specific, verified data: exact recycled content percentage, certification body, and end-of-life instructions verified for your specific sales markets.
The environmental cost of packaging waste has been hidden for decades inside a system that treated disposal as someone else’s problem. That system is breaking down under the weight of 353 million tonnes of annual plastic waste, 11 million tonnes of annual ocean pollution, microplastics in the human body, and a cascade of regulation that is making the externality explicit.
The companies that gain competitive advantage in this transition will be the ones who moved before the mandate arrived. Reusable packaging reduces solid waste by up to 96%. Recycled content is growing in demand and supply chain availability. Consumer preference for sustainable packaging is not declining it is accelerating, with 78% actively seeking recyclable options.
The hidden cost is becoming a visible, measured, and increasingly litigated cost. Businesses that treat that reality as an opportunity will build durable brands. Those that treat it as a burden will find regulators, litigators, and consumers drawing their attention to it at a time and manner not of the business’s choosing.
The hidden environmental costs include carbon emissions from raw material extraction and manufacturing, pollution from transportation, and long-term environmental damage from landfill, incineration, and ocean leakage.
Packaging especially plastic generates greenhouse gas emissions throughout its lifecycle, from fossil fuel extraction to production and disposal, making it a significant contributor to climate change.
Plastic packaging often ends up in oceans, where it breaks down into microplastics. These particles harm marine life and have been found in human lungs, blood, and even heart tissue.
Industries like e-commerce, food and beverage, retail, and consumer goods are heavily impacted due to high packaging volumes and increasing regulatory and consumer pressure.
Companies can reduce impact by using recyclable or reusable materials, minimizing packaging, improving design efficiency, and aligning with circular economy principles and regulations from the European Commission.