Quick summary: Learn how biochar is produced feedstocks, pyrolysis tech, decentralized vs industrial systems, and the traceability gap holding carbon credits back.
In 2024, Microsoft signed offtake agreements for more than 130,000 tonnes of biochar-based carbon removal its largest single nature-based removal commitment to date (CDR.fyi, 2024). Frontier, Stripe Climate, and JPMorgan followed. The signal is unmissable: biochar has moved from soil-science footnote to one of the most credible engineered carbon removal pathways on Earth. The biochar production process is technically mature. The supply chain around it is not.
Not because the carbon math is wrong but because nobody can prove where the feedstock came from, what temperature the kiln actually hit, or whether the same tonne was sold twice.
This guide walks through how biochar is actually made from feedstock selection through pyrolysis to end-use and then does what most explainers skip: it shows where the traceability gaps are, why they kill credit value, and what production-stage data you need to capture if biochar is going to fund itself.
Key takeaways
Biochar is produced by pyrolyzing biomass agricultural residues, forestry waste, or invasive species at 400–700°C in low-oxygen conditions, locking ~50% of feedstock carbon into a stable, soil-applicable solid for 100+ years (IPCC AR6, 2022). Production happens at two scales: decentralized kilns near farms (~0.5–2 tonnes/day) and industrial continuous reactors (50+ tonnes/day). The bottleneck for the $600M+ biochar carbon credit market isn’t chemistry it’s supply chain traceability. Without verifiable feedstock origin, pyrolysis conditions, and end-use data, biochar credits get rejected by registries like Puro.earth and Verra.
| WHO THIS GUIDE IS FOR Carbon project developers building biochar removal pipelines · Agri-food sustainability heads exploring on-farm carbon insetting · Procurement leads sourcing verified biochar credits for Scope 3 reduction · NGOs and climate-tech startups running smallholder biochar programs across India, Africa, and Southeast Asia. |
The biochar production process is the thermal decomposition of organic biomass in a low- or zero-oxygen environment a reaction called pyrolysis at temperatures typically between 400°C and 700°C, producing a stable, carbon-rich solid that resists microbial breakdown for centuries. Roughly 50% of the feedstock’s original carbon is locked into this solid; the rest becomes syngas and bio-oil, which most modern systems recover for process heat or co-products.
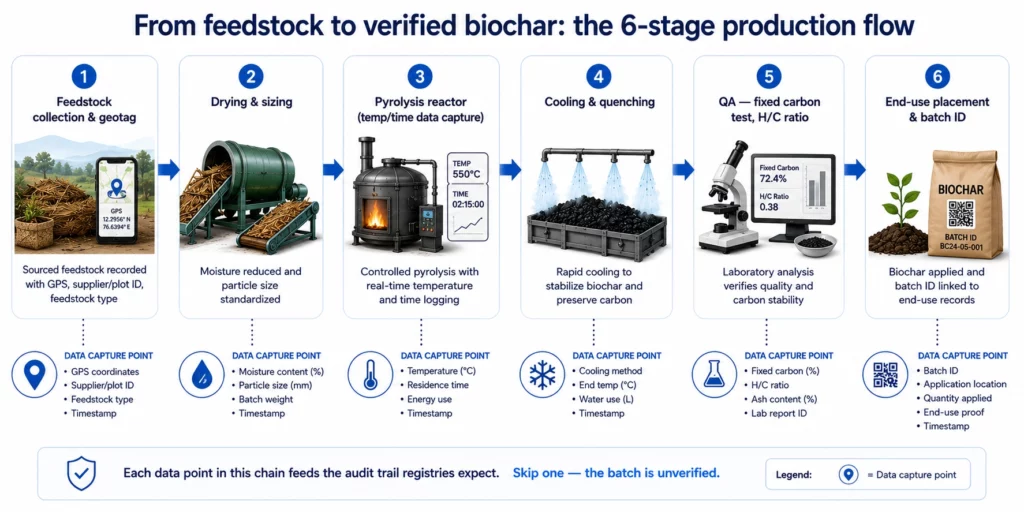
Strip away the chemistry and the production process has four operational stages:
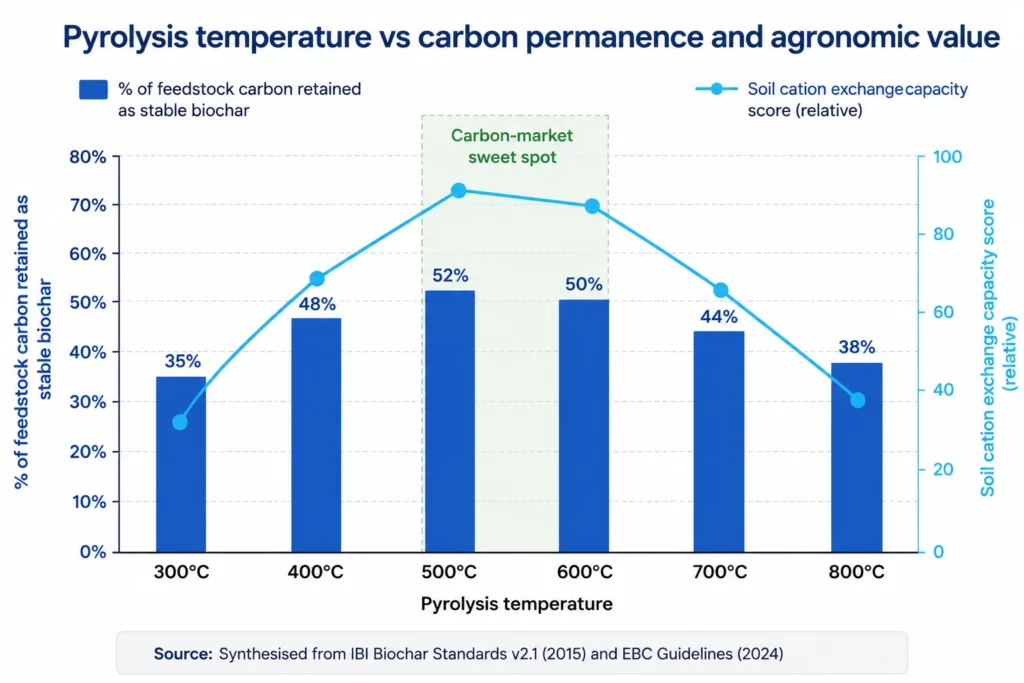
The temperature window is where the carbon market value is won or lost. Char produced below 400°C has too much volatile content to count as permanent carbon storage. Char produced above 700°C loses agronomic value because surface functional groups burn off. The sweet spot 500–600°C is where both soil benefit and 100-year carbon permanence intersect. Most informal kilns can’t hold that range. Continuous industrial reactors can. This single fact explains why nearly all premium-priced biochar credits in 2025 came from industrial-scale producers, even though decentralized units make up the volume.
Explore how biochar is emerging as a scalable carbon removal solution.
Learn how traceable biochar projects support carbon sequestration, climate goals, MRV transparency, and sustainable supply chains.
Biochar can be produced from virtually any lignocellulosic biomass, but only a narrow subset of feedstocks qualifies for carbon credit issuance: residues from agricultural, forestry, or processing waste streams that would otherwise decompose, burn openly, or go to landfill. The European Biochar Certificate restricts inputs to a positive list virgin biomass grown specifically for biochar is excluded.
In practice, four feedstock categories dominate global production:
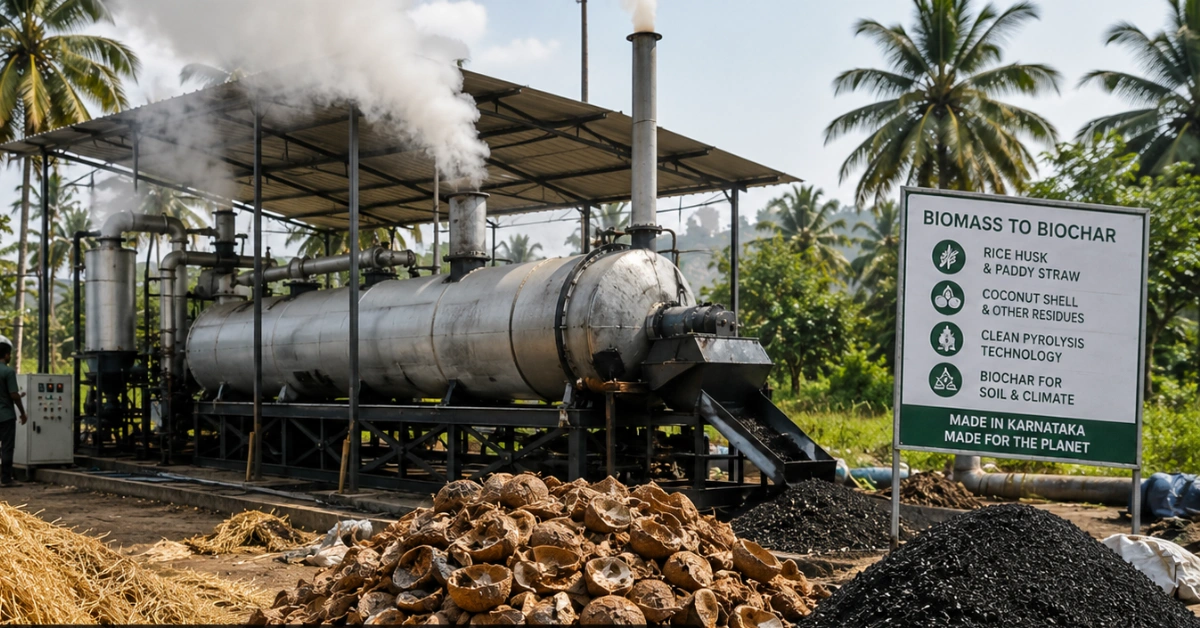
Rice husk, rice straw, sugarcane bagasse, coconut shell, corn stover, wheat straw, cotton stalks, groundnut shells. India alone generates over 500 million tonnes of crop residue annually, of which ~92 million tonnes is burned in open fields each year (ICAR-NAAS, 2023) a public health crisis that biochar conversion directly addresses.
Sawmill offcuts, bark, chipper waste, prunings from plantation forestry, invasive species clearance (lantana, prosopis). Higher lignin content typically yields denser, longer-lasting biochar preferred for premium soil-amendment markets.
Poultry litter, dairy manure, pig slurry solids. Pyrolysis sterilises pathogens and locks nitrogen into stable forms, but high ash content can disqualify the output from soil-grade certification. Manure-derived biochar is often routed to industrial applications instead.
Food-processing residues (coffee grounds, fruit pomace, nut shells), green waste from municipal collection, sewage sludge. Strictest screening required heavy metals and persistent organic pollutants can disqualify outputs entirely.
Feedstock comparison at a glance
| Feedstock | Biochar yield | Carbon content | Credit eligibility | Best end-use |
|---|---|---|---|---|
| Rice husk | 35–40% | Medium | High | Paddy soil amendment, cement supplementary |
| Coconut shell | 25–30% | Very high (>80%) | High | Activated carbon, premium soil amendment |
| Wood / forestry residue | 28–35% | High | High (if sustainably sourced) | Horticulture, vineyard, livestock bedding |
| Sugarcane bagasse | 25–30% | Medium | Medium | Sugarcane fields (closed loop) |
| Poultry litter | 30–40% | Low–Medium | Conditional | Industrial sorbent, fertiliser blend |
| Sewage sludge | 40–50% | Low | Low (metals risk) | Construction materials, road base |
The most overlooked feedstock issue isn’t yield, it’s displacement risk. If your biochar project sources rice husk that was already feeding a cement plant or a power boiler, the EU’s draft methodology for biochar removals counts that as a net-zero benefit. Carbon registries are now demanding feedstock origin proofs that show the biomass was genuinely a waste stream, not a redirected commodity. This is a traceability problem, not a chemistry problem. Plenty of well-funded projects discover it only at audit.
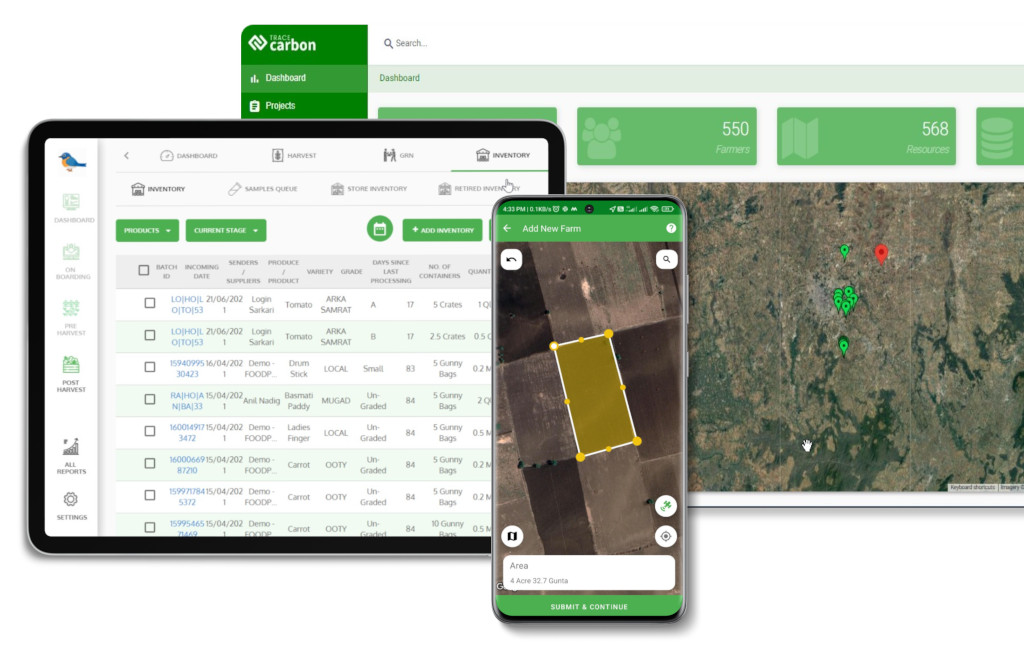
| Mapping feedstock origin matters more than you think. TraceX geo-tags every farm or collection point feeding your pyrolysis unit, links it to satellite-verified land use, and creates an immutable record that survives audit. Useful for EUDR-adjacent, Puro.earth, and Verra VM0044 submissions. See the Sustainable Sourcing platform → |
Discover how biochar improves soil health while supporting sustainable agriculture.
Explore the role of biochar in enhancing soil fertility, water retention, nutrient efficiency, and long-term carbon storage.
Pyrolysis is the thermochemical decomposition of organic matter in the absence of oxygen and the variable that determines almost everything (yield, carbon stability, syngas vs bio-oil ratio, scale) is heating rate combined with residence time. This is why the industry talks about three pyrolysis regimes, each producing different output ratios from the same input (Lehmann & Joseph, Biochar for Environmental Management, 3rd ed., 2024):
Heating rate: ~5–10°C per minute. Residence time: 30 minutes to several hours. Temperature: 400–600°C. Output mix: ~35% biochar, ~30% bio-oil, ~35% syngas. This is the dominant regime for any operation that prioritises biochar as the primary product. Almost all carbon credit-grade biochar comes from slow pyrolysis.
Heating rate: >100°C per second. Residence time: 1–2 seconds. Temperature: ~500°C. Output mix: ~75% bio-oil, ~12% biochar, ~13% syngas. Optimised for liquid biofuel — biochar is a co-product, often lower quality.
Higher temperatures (>700°C) with controlled air or steam. Output mix: ~85% syngas, ~10% biochar, ~5% tar. The char yield is lowest, but the syngas can run a CHP unit, making this the route of choice for off-grid energy + biochar combined projects.
Neither model wins outright they serve different value chains. Decentralized production (small kilns near the field) currently delivers most of the global biochar volume by tonnage but captures less than 25% of the carbon credit revenue. Industrial production (continuous reactors at >20 tonnes/day) delivers a smaller share of physical volume but earns the premium prices, because it produces more consistent quality and critically generates the digital audit trail that buyers demand (IBI Global Market Outlook, 2024).
Decentralized vs industrial — head-to-head
| Factor | Decentralized (smallholder / village) | Industrial (continuous reactor) |
|---|---|---|
| Capacity | 0.1–2 tonnes biochar / day | 20–200+ tonnes / day |
| CapEx | $500 – $50,000 | $1M – $20M+ |
| Feedstock logistics | Source within 5–10 km — low transport cost | Source within 50–200 km — significant logistics |
| Temperature control | Variable — depends on operator skill | Tight (sensors, PLC control) |
| Quality consistency | Batch-to-batch variance high | Within ±5% on key parameters |
| Credit price (2025 avg) | $80 – $140 / tCO₂e | $180 – $350 / tCO₂e |
| Traceability | Mostly paper/manual — major audit risk | Digital — if instrumented |
| Co-benefit potential | High — rural income, residue burning reduction | Moderate — large-scale waste diversion |
The hybrid model is where most of the next decade’s growth will sit. A network of 20–50 decentralized pyrolysis units feeding a central aggregator that consolidates volumes, runs quality control, and issues a single verified batch to the credit registry. This is essentially the cooperative model applied to carbon and it only works if every decentralized unit is digitally connected. Without per-unit data capture, the aggregator can’t prove anything. We’ve seen carbon project developers spend 18 months building this network only to discover the data layer was the missing piece. Build the traceability infrastructure first; bolt on the kilns second.
If the biochar production process is mature, supply chain traceability is where the market actually gates value.
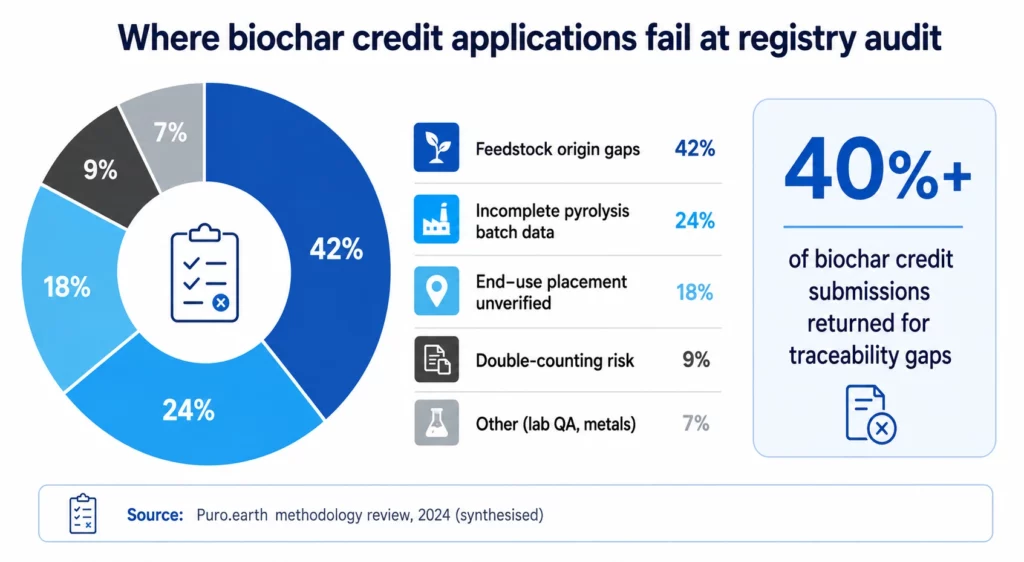
A 2024 Puro.earth audit review found that over 40% of biochar credit applications were returned for traceability gaps missing feedstock provenance, incomplete pyrolysis logs, or unverifiable end-use placement (Puro.earth methodology review, 2024). The carbon is real. The chain of custody isn’t documented.
Carbon registries — Puro.earth, Verra VM0044, Riverse, Isometric now require six data layers across the biochar supply chain:
This is the exact gap TraceX’s Digital MRV platform was built to close. Blockchain-backed records mean batch data, lab QA, and end-use can’t be edited after the fact which is the single most common audit finding in the biochar space. The platform also captures Scope 3 emissions from the production chain itself (transport, drying energy), so the net carbon claim survives scrutiny.
Take a project in Andhra Pradesh aggregating biochar from 12 village-level kilns processing rice straw and groundnut shell. Without digital traceability, the project sits on ~3,000 tonnes of unverified biochar. With per-kiln data capture feedstock weight, GPS-tagged source plots, batch temperature logs, end-use farm placement the same volume becomes ~6,000 tCO₂e of registry-listed credits at $130/tCO₂e. The biochar didn’t change. The data layer did.
Whether you’re a sustainability head sourcing biochar for insetting, a procurement team buying credits, or a project developer building a pyrolysis network, the diligence checklist is converging. Industry buyers Microsoft, Frontier, Stripe now publish their evaluation criteria. The non-negotiables for any biochar offering in 2026 look like this:
Most biochar diligence frameworks circulating in 2025 still don’t ask the right question first. The first question shouldn’t be ‘what’s your H/C ratio?’ It should be ‘show me the digital trail from the farm to the end-use placement of one specific batch you sold last quarter.’ If the seller can produce that in under 10 minutes, the project is operationally mature. If they need three days and an email chain, the credits aren’t ready for institutional buyers regardless of the chemistry.
Biochar production has been understood for 2,000 years (the terra preta soils of the Amazon are pre-Columbian biochar applications). Pyrolysis reactors are off-the-shelf engineering. Feedstocks are abundant in every agricultural geography on Earth. What separates a biochar project that earns $80/tonne from one that earns $300/tonne in 2026 is not chemistry it is the ability to prove, with digital certainty, where each tonne came from, how it was made, and where it ended up.
That data layer is now a market entry requirement, not a nice-to-have.
Charcoal and biochar are produced by similar pyrolysis processes, but biochar is specifically engineered for soil application and carbon sequestration — with controlled temperature, low contaminant load, and certified H/C molar ratio below 0.7. Charcoal is optimised for combustion (fuel) and doesn’t have to meet stability or purity standards (IBI Standards v2.1, 2015).
Biochar produced at 500–700°C with H/C <0.7 sequesters carbon for 100 to 1,000+ years, depending on soil conditions and original feedstock. The IPCC AR6 report classifies biochar as a verified carbon dioxide removal pathway with permanence in the centuries-to-millennia range (IPCC, 2022). This is why it qualifies for premium engineered-removal credits.
The optimal temperature window is 500–600°C for most agricultural and forestry feedstocks. Below 400°C, volatile compounds remain and the carbon isn’t stable enough for credit issuance. Above 700°C, surface functional groups burn off and agronomic value drops. This narrow window is why precise temperature control is the single biggest separator between credit-grade and commodity-grade biochar.
It depends on scale and end-market. Decentralized smallholder production rarely breaks even on the biochar product alone — carbon credit revenue typically accounts for 50–70% of project economics. Industrial production targeting premium soil-amendment, activated carbon, or concrete admixture markets can be viable without credits, but those markets are still under 15% of global biochar demand (IBI Market Report, 2024).
Request three documents: (1) an IBI or EBC certificate for the specific batch, (2) a lab report showing H/C molar ratio, fixed carbon %, and heavy metals, and (3) a chain-of-custody record showing feedstock origin and end-use placement. If any of the three is missing or unverifiable, the biochar isn’t fit for science-based sustainability claims — regardless of price.